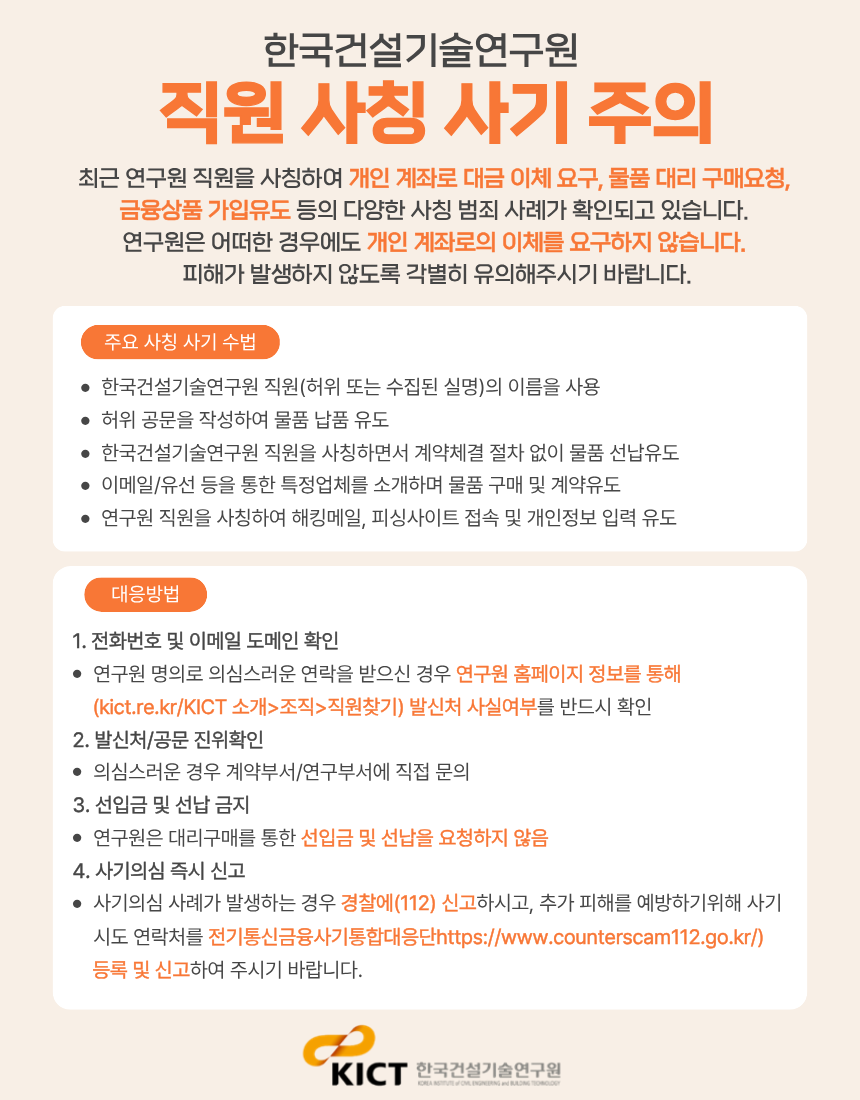
본문 바로가기
KICT 한국건설기술연구원
About KICT
Welcome Message
Mission & Function
History
Personnel & Budget
Social Responsibility
Organization
Staff
KICT CI
Contact
Related Organization
Location
Ilsan HeadQuarters (Main Research Facilities)
Department of Fire Safety Research (Hwaseong)
River Experiment Center (Andong)
Yeoncheon SOC Demonstration Center
Research Division
Department of Highway & Transportation Research
Introduction
Staff
Papers
Department of Structural Engineering Research
Introduction
Staff
Papers
Department of Geotechnical Engineering Research
Introduction
Staff
Papers
Department of Building Research
Introduction
Staff
Papers
Department of Hydro Science and Engineering Research
Introduction
Staff
Papers
Department of Environmental Research
Introduction
Staff
Papers
Department of Future & Smart Construction Research
Introduction
Staff
Papers
Department of Fire Safety Research
Introduction
Staff
Papers
Department of Building Energy Research
Introduction
Staff
Papers
Department of Construction Test & Certification
Introduction
Staff
Papers
Department of Construction Industry Promotion
Introduction
Staff
Papers
Department of Construction Policy Research
Introduction
Staff
Papers
Korea Construction Standards Center
Introduction
Staff
Papers
Research Information
Research Reports
Press Release
Research Facilities
Ilsan HeadQuarters (Main Research Facilities)
Department of Fire Safety Research (Hwaseong)
River Experiment Center (Andong)
SOC Demonstration Research Center (Yeoncheon)
Research videos
Industrial Support
Smart Construction Support Center
Intro
Smart construction startup idea contest
Office and support space for resident companies and support for residents
Open Incubation Program
Smart Construction Innovation Startup Program
Smart Construction Technology Plaza
Intro
Registration Procedure
Review Items
Utilization Strategies
Smart Construction Alliance
Intro
SME Support
Technology Transfer
Accreditation Certification and Testing
Standard of Construction Estimate
International Cooperation
International Activities
International Memorandum of Understanding (MOU)
UST-KICT School
News & Notice
News & Notice
Global KICT
Global Recruiting
Information
Notice
Brochure
PR Film
Newsletter
Lab Tour
직원찾기
페이스북
블로그
KOR
전체메뉴
검색
닫기
About KICT
Research Division
Research Information
Industrial Support
International
Cooperation
News & Notice
About KICT
Welcome Message
Mission & Function
History
Personnel & Budget
Social Responsibility
Organization
Staff
KICT CI
Contact
Related Organization
Location
Ilsan HeadQuarters (Main Research Facilities)
Department of Fire Safety Research (Hwaseong)
River Experiment Center (Andong)
Yeoncheon SOC Demonstration Center
Research Division
Department of Highway & Transportation Research
Introduction
Staff
Papers
Department of Structural Engineering Research
Introduction
Staff
Papers
Department of Geotechnical Engineering Research
Introduction
Staff
Papers
Department of Building Research
Introduction
Staff
Papers
Department of Hydro Science and Engineering Research
Introduction
Staff
Papers
Department of Environmental Research
Introduction
Staff
Papers
Department of Future & Smart Construction Research
Introduction
Staff
Papers
Department of Fire Safety Research
Introduction
Staff
Papers
Department of Building Energy Research
Introduction
Staff
Papers
Department of Construction Test & Certification
Introduction
Staff
Papers
Department of Construction Industry Promotion
Introduction
Staff
Papers
Department of Construction Policy Research
Introduction
Staff
Papers
Korea Construction Standards Center
Introduction
Staff
Papers
Research Information
Research Reports
Press Release
Research Facilities
Ilsan HeadQuarters (Main Research Facilities)
Department of Fire Safety Research (Hwaseong)
River Experiment Center (Andong)
SOC Demonstration Research Center (Yeoncheon)
Research videos
Industrial Support
Smart Construction Support Center
Intro
Smart construction startup idea contest
Office and support space for resident companies and support for residents
Open Incubation Program
Smart Construction Innovation Startup Program
Smart Construction Technology Plaza
Intro
Registration Procedure
Review Items
Utilization Strategies
Smart Construction Alliance
Intro
SME Support
Technology Transfer
Accreditation Certification and Testing
Standard of Construction Estimate
International Cooperation
International Activities
International Memorandum of Understanding (MOU)
UST-KICT School
News & Notice
News & Notice
Global KICT
Global Recruiting
Information
Notice
Brochure
PR Film
Newsletter
Lab Tour
KOR
전체메뉴 닫기
Research Division
Department of Highway & Transportation Research
Introduction
Staff
Papers
Department of Structural Engineering Research
Introduction
Staff
Papers
Department of Geotechnical Engineering Research
Introduction
Staff
Papers
Department of Building Research
Introduction
Staff
Papers
Department of Hydro Science and Engineering Research
Introduction
Staff
Papers
Department of Environmental Research
Introduction
Staff
Papers
Department of Future & Smart Construction Research
Introduction
Staff
Papers
Department of Fire Safety Research
Introduction
Staff
Papers
Department of Building Energy Research
Introduction
Staff
Papers
Department of Construction Test & Certification
Introduction
Staff
Papers
Department of Construction Industry Promotion
Introduction
Staff
Papers
Department of Construction Policy Research
Introduction
Staff
Papers
Korea Construction Standards Center
Introduction
Staff
Papers
Research Achievements
Home
Research Division
Department of Infrastructure Safety Research
Research Achievements
공유하기
페이스북
트위터
카카오스토리
링크공유
프린트
Introduction
Staff
Research Achievements
Papers
검색
ALL
Subject
Content
Search
TOTAL
14
Current page
1
/
2
AI-Based GPR Data Analysis Technology for Detecting Underground Cavities and Buried Objects
Research Fellow Lee Dae-young, Department of Geotechnical Engineering Research, KICT Prologue In recent years, a series of large-scale ground subsidence accidents have occurred in urban areas such as Seoul. Examples include the sinkhole accident in Myeongil-dong, Gangdong-gu, Seoul, and the underground collapse at the Sinansan Line construction site in Gwangmyeong. Following these incidents, the Seoul Metropolitan Government announced that it would be strengthening safety management against ground subsidence by conducting intensive Ground Penetrating Radar (GPR) surveys in the areas around excavation sites (Seoul City, 2025). Ground Penetrating Radar (GPR) is a geophysical survey method that uses electromagnetic waves to detect underground structures such as sewer pipelines, buried utilities, and cavities. Since the large-scale cavity incident at the Seokchon Underpass in 2014, GPR surveys have been actively applied to investigate subsurface cavities and ground subsidence beneath urban roads. As a non-destructive survey technique, GPR is useful for identifying underground utilities, cavities, and soil structures. However, it has several limitations, including depth restrictions depending on frequency, sensitivity to soil conditions, and difficulties in data interpretation. In addition, GPR analysis relies heavily on expert interpretation, and for high-resolution or 3D surveys, the data processing and interpretation require a significant amount of time, with notable variations in the reliability of the results. To address these issues, research is now underway on AI-based methods for automatically analyzing GPR data. This article introduces the principles of GPR surveys, along with AI-based methods for analyzing GPR data to improve the accuracy of interpretation, shorten analysis time, and enable real-time analysis. Principle of GPR Surveys Ground Penetrating Radar (GPR) is a survey technique that can identify the location and shape of underground structures such as buried pipelines through transmitting electromagnetic waves into the ground and receiving the reflected signals generated at the boundaries of such structures, while considering their different electrical properties (conductivity and permittivity). GPR employs radio waves with frequencies of several tens of MHz or higher, and is mainly used as a non-destructive testing method to investigate relatively shallow targets at depths of approximately 1–3 meters. It is applied to the detection of underground utilities, cavities, tunnel voids, and stratigraphic structures. More recently, GPR surveys have been intensively conducted in areas where ground subsidence is a concern due to aging sewer pipelines, serving as an evaluation method to help prevent ground collapse (Figure 1). In the analysis of GPR survey data, buried pipelines exhibit strong amplitudes and appear in the form of hyperbolae, as shown in Figure 2. While single-channel GPR systems using one transmitter and receiver pair have been mainly used, high-resolution three-dimensional multi-channel GPR systems have recently come into wider application. GPR surveys are effective for targets buried at shallow depths of up to approximately 3 meters, within which range most pipelines are located, but have limitations when it comes to deeper investigations, such as tunnel construction or large-scale excavation sites. GPR Data Using AI Techniques In the context of the Fourth Industrial Revolution, the outstanding performance and popularization of Artificial Intelligence (AI) technologies have further expanded their applicability. The application of AI to GPR analysis has potential to improve the accuracy and efficiency of underground structure detection and reduce interpretation errors. Recently, to address errors and technical challenges that arise during GPR image interpretation, research utilizing deep learning—one of the machine learning techniques widely applied in the field of image processing—has been actively conducted. The AI-based method for analyzing GPR data involves collecting GPR data in B-scan and C-scan formats, performing noise removal and corrections, and then carrying out data labeling. After generating a corrected labeled training dataset, a Convolutional Neural Network (CNN)-based AI algorithm is used for object detection (Girshick, 2014). Through deep learning, the reliability of buried pipeline detection can be significantly enhanced. The Korea Institute of Civil Engineering and Building Technology (KICT) has conducted research on the application of AI to improve the accuracy of GPR surveys for cavity detection in the ground and the investigation of underground obstacles beneath roads, with the aim of preventing ground subsidence. GPR survey data were used to detect buried pipelines and cavities, and high-quality labeled datasets were generated by converting the GPR data into images and removing noise such as clutter. For the detection of underground utilities and cavities, the Faster R-CNN algorithm was applied, and by employing various training techniques, optimal performance for detecting buried pipelines and cavities was achieved. Through this effort, the KICT developed AI algorithms and GPR data analysis technologies capable of detecting underground cavities and buried pipelines. Epilogue With the acceleration of urban development and the resulting increase in large-scale excavation works, as well as the occurrence of urban sinkholes caused by aging infrastructure, the use of GPR surveys for detecting cavities and ground subsidence has become increasingly important. Recently, research has been progressing on the application of AI technologies to advance GPR data analysis. Integrating AI into GPR surveys can reduce data processing time while improving the consistency and accuracy of interpretation results, thereby overcoming the limitations of traditional GPR analysis. AI-based automatic analysis technology also enables the real-time processing of GPR data and reduces interpretation errors, allowing decision-making processes to move more quickly. Ultimately, this technology can play a vital role in preventing ground subsidence accidents and enhancing the safety of underground utilities. References Seoul Metropolitan Government (2025). Special Countermeasures for Strengthening Safety Management Against Ground Subsidence at Large Urban Excavation Sites. Press Release, Road Management Division, Disaster and Safety Office, Seoul Metropolitan Government. Lee, Dae-young (2015). Development of Ground Subsidence Evaluation Methods Caused by Damage to Old Sewer Pipes. Proceedings of the Joint Conference of the Korean Society of Water and Wastewater (KSWW) and the Korean Society on Water Environment (KSWE), Special Session V-1. Lee, Dae-young (2018). Risk Assessment of Sewer Defects and Ground Subsidence Using CCTV and GPR. Journal of the Korean Geosynthetics Society (KGSS), Vol. 17, No. 3, pp. 47–55. Korea Institute of Civil Engineering and Building Technology (2022). Development of Smart QSE-Based Undergrounding Innovation Technology for Overhead Lines and Road Performance Restoration Technology (1/3), Annual Report. Korea Institute of Civil Engineering and Building Technology (2024). Development of Smart QSE-Based Undergrounding Innovation Technology for Overhead Lines and Road Performance Restoration Technology (3/3), Final Report https://ashutoshmakone.medium.com/faster-rcnn502e4a2e1ec6 R. Girshick, J. Donahue, T. Darrell, and J. Malik (2014) “Rich feature hierarchies for accurate object detection and semantic segmentation,” In Proc. CVPR.
Department of Geotechnical Engineering Research
Date
2025-09-24
Hit
150
Development of Digital Image-Based Soil Color Assessment Technologies
Development of Digital Image-Based Soil Color Assessment Technologies ▲ Senior Researcher Kwak Tae-young, Department of Geotechnical Engineering Research, KICT Prologue Soil color is widely used as a fundamental indicator for classifying and predicting soil properties, as it is known to be influenced by factors such as mineral composition, organic content, moisture content, and ion concentration, among others. Particularly in the field of agriculture, soil color is utilized as a prominent indicator for classifying soils, and suitable farming practices and crop types are determined based on soil color variations. Additionally, in civil engineering, the color of soil samples collected during soil surveying of a site is recorded in the boring log. This practice is based on the understanding that soils with similar colors in adjacent areas are highly likely to have similar geotechnical properties. Color is typically determined through visual observation. The MUNSELL Soil Color Charts shown in Figure 1 were developed to objectively differentiate observed soil colors based on combinations of hue, value, and chroma. However, the method of determining soil color using MUNSELL Soil Color Charts has the following limitations: ① It is susceptible to the subjectivity of the observer, ② the color of soil samples and the standard color chips can vary depending on environmental conditions like lighting, and ③ the standard color chips are discontinuous, making numerical or statistical analysis challenging. Recently, digital image-based soil color assessment technology has been highlighted as a means of overcoming these limitations. Digital image processing involves a series of computer-based processes to analyze digital images, allowing for rapid and objective soil color determination without the need for observer involvement. Furthermore, since soil color is represented as continuous values in digital image-based systems, it offers the advantage of enabling numerical or statistical analysis. Current Status of Development of Digital Image-Based Soil Color Assessment Technologies Current Status of Development of Digital Image-Based Soil Color Assessment Technologies Variations in Soil Color Due to Changes in Lighting Conditions Figure 2 presents digital images of granitic soils in the Anseong area, captured under lighting conditions simulating natural light. Despite capturing consistently prepared soil samples with the same camera settings, the soil color displayed in the images varied significantly based on the lighting's color temperature and illuminance. Color temperature is a measure of the color of light sources expressed in absolute temperature (K). The lower the color temperature, the redder the light source; the higher the color temperature, the bluer the light source. Illuminance is a measure of the intensity of light received on a specific surface. As illuminance increases, the light source becomes brighter. Soil color exhibited a similar trend to changes in color temperature and illuminance of the lighting. The phenomenon of soil color changing with lighting conditions highlights the clear limitations of previous studies that were not applicable in practical field settings. It is believed that the development of a digital image-based soil color analysis method that can consider irregular lighting conditions would further enhance the universality and applicability of research findings in practical field settings. Development of Digital Image Processing-Based Soil Color Analysis Technology A color system is a method of numerically representing colors, expressing a specific color as a point in a color space. There are various ways to define a color space, depending on the color system used. Some common color systems include RGB, HSV, CIEXYZ, CIExyY, CIELAB, and CIELUV (Billmeyer and Saltzman, 1981). In this study, two color systems, RGB and CIELAB, were utilized for soil color analysis. The RGB color system is the method most widely used in electronic devices such as digital cameras, and represents colors using the three primary colors of light: red (R), green (G), and blue (B). The RGB color system has the advantage of being able to reproduce most colors through a simple combination of the three colors. However, it cannot represent all the colors that the human eye can perceive. To overcome this limitation, the International Commission on Illumination (CIE) proposed the CIELAB color system based on the CIEXYZ color system (CIE, 1978). In the CIELAB color system, colors are expressed as a combination of L*, a*, and b*. L* represents the brightness of the color and ranges from 0 (dark) to 100 (bright). Additionally, a* and b* represent color values, and a* represents which side of red (positive number) and green (negative number) it is closer to, while b* indicates which side of yellow (positive number) and blue (negative number) it is closer to. Color System for Digital Image-Based Soil Color Analysis In an attempt to overcome the limitations of previous researches, the Korea Institute of Civil Engineering and Building Technology (KICT) has developed a digital image processing-based soil color analysis technology that can consider irregular lighting conditions in the field. As shown in Figure 3, a digital image capture studio was established to simulate natural light conditions. Various soil samples, including a single silica-based sand sample and granitic soil collected from four different regions, were photographed under different lighting conditions. Digital image processing was performed on the captured sample images to extract and analyze soil color in various color systems (RGB, CIELAB). In the RGB color system-based soil color analysis, it was observed that as the illuminance of the lighting intensified, the soil color components (R, G, B) also increased. Of the RGB components, green (G), which is known to have the highest correlation with brightness, showed a very high correlation with illuminance. However, red (R) and blue (B) showed relatively lower correlations due to the influence of color temperature. Since soil color represented in the RGB color system is influenced to some extent by both illuminance and color temperature, it was considered challenging to completely exclude (or correct for) the effects of lighting conditions using this system. The analysis of soil color based on the CIELAB color system revealed that L* is influenced only by illuminance, while a* and b* are affected solely by color temperature, and the correlations were high. This is attributed to the fact that L* represents the brightness of the color, while a* and b* are indicators of hue. Based on the analysis of the relationship between L* and illuminance, as well as a* and b* with color temperature within the CIELAB color system, I proposed the following soil color correction equations according to varying lighting conditions. In this context, I and T represent the illuminance and Color temperature received by the soil, respectively. aL and fL denote the slope and intercept of the linear regression equation between the L* value of soil color and Illuminance, while aa and fa represent the slope and intercept of the linear regression equation between the a* value of soil color and color temperature, and ab and fb signify the slope and intercept of the linear regression equation between the b* value of soil color and color temperature. For dry soil, it was confirmed that the slopes (i.e., aL, aa, ab) in Equations (1) to (3) are similar, regardless of the type of sample. Ultimately, the following correction equation was proposed. Through the proposed method, it is possible to correct the soil color of soil samples captured under arbitrary lighting conditions to the desired soil color under specific lighting conditions. More detailed correction procedures are described in Baek et al. (2023). Epilogue The KICT is currently developing a digital image-based soil color analysis technology that can consider irregular lighting conditions in the field. As shown by the results of an analysis of captured images, it appears that the impact of irregular lighting conditions on soil color can be eliminated (or corrected) based on the CIELAB color system. Using the analysis results for dry soil samples, a lighting condition correction equation has been proposed. In addition, currently, analyses are being conducted for soil samples containing water. Once the analysis for water-containing unsaturated soils is completed, it will become possible to acquire soil color quickly and easily from digitally captured soil images in the field, regardless of moisture content, enabling statistical analysis.
Department of Geotechnical Engineering Research
Date
2023-10-11
Hit
630
Firefly Sensor Developed for the Monitoring of Ground Failures
Firefly Sensor Developed for the Monitoring of Ground Failures ▲ Department of Geotechnical Engineering Research, KITC - Smart Sensor and System Developed to Detect Symptoms of Ground and Structural Failure - Field-deployable, Fast, and Accurate Technology that Contributes to Public Safety The Korea Institute of Civil Engineering and Building Technology (KICT) has developed a smart detection sensor (Firefly Sensor), which can detect signs of ground and structural failure, along with a real-time remote monitoring system. The technology was developed jointly with Disaster Safety Technology Co., Ltd., KICT's first research affiliated company, and EMTAKE Co., Ltd., a Korean venture company. The developed Firefly Sensor can be easily mounted in various high-risk areas where ground failures are a concern, with a spacing of 1 m to 2 m. In addition, it can detect deviations as small as 0.03° in real-time, surpassing the 0.05° threshold of the slope inclinometer criteria set by the Korea Forest Service for slope collapse. When a sign of collapse is detected, an immediate alert is triggered using LED illumination. The LED alert utilizes high-efficiency optical transmission lens technology, enabling managers and workers on site to visually confirm the alert, even at a distance of 100 m during daylight hours. Site conditions can be simultaneously and remotely monitored from the control room in real time, facilitating additional measures such as sharing the risk situation with related institutions. In addition, the sensor offers easy installation, resulting in more than a 50% cost savings compared to the installation and operation expenses of conventional measurement sensors. It offers the advantage of operating for a full year without battery replacement, thanks to its ultra-low power design. Additionally, the sensor is designed to operate reliably in extreme temperatures ranging from -30°C to 80°C, and is considered especially suitable for regions with distinct seasonal variations. The Firefly Sensor is equipped with an algorithm technology that prevents malfunctions by analyzing and assessing risks based on the installation location. This means that it can be utilized in a range of locations that includes construction and civil engineering sites, aging buildings, cultural heritage and fortress structures, steep slopes, areas prone to landslides, tunnel construction, mines and underground structures, bridges, dams, areas where erosion protection is needed, and more. Currently, the Firefly Sensor is being operated in pilot installations that include Jeju Lava Cave, water treatment and sewage plants in Incheon, cut slopes and mountain slopes along national highways, the KINTEX station section of the GTX-A route, construction sites for apartment complexes in Daejeon and Damyang-gun, and LG chemical factories. It has also been incorporated into the design of the extension project for the 2023 Sin Bonding Line. It is expected that its application in national infrastructure construction projects, including in the demolition of buildings, will increase. This achievement would not have been possible without the support of the Ministry of Science and ICT, specifically as part of the KICT's main project (Regional Cooperation Project) entitled "Development of Jeju-type Ground Subsidence Response System for Road Safety Operation (2020-2022)."
Department of Geotechnical Engineering Research
Date
2023-06-27
Hit
753
Using Robotic Technology to Inspect Underground Spaces
Using Robotic Technology to Inspect Underground Spaces ▲ Senior Research Fellow Lee Seong-won and Research Specialist Shim Seung-bo, Department of Geotechnical Engineering Research Complex and Diverse Underground Spaces The underground space of the city is a familiar place. It has huge shopping malls, serves as a passageway for transportation, and becomes a workplace as well. With the full utilization of underground spaces, the range of human activity has been expanded greatly, but is also naturally accompanied by risks. There are various risk factors such as collapse or flooding that accompany the underground space. The Department of Geotechnical Engineering Research at KICT is researching geotechnical engineering technologies that are essential to civil engineering construction, such as for tunnels and underground spaces, structural foundations, slopes, soft ground, and earthquakes. “Based on our current progress in research and development, the Department of Geotechnical Engineering Research is working with a focus on four major research subjects. To be specific, when constructing earthworks and foundation structures, they are classified under “development of technologies for automation of quality control,” “development of technologies for advanced management of three-dimensional infrastructure,” “development of technologies for securing safety of earthquake response facilities,” and “development of technologies for utilizing large underground spaces.” Members of the department are dedicated to the research based on expertise in their respective field. With our cutting-edge research achievements, we are leading the development of technologies for South Korea’s underground spaces.” With industrialization progressing in earnest, Korea's underground spaces are also becoming more and more complex. As the highways were built, tunnels through mountains were also constructed in various places, and recently the world's fifth longest undersea tunnel was opened in Boryeong. Research Specialist Sim Seung-bo explains that the underground space in Korea can be largely classified into railway tunnels, road tunnels, undersea tunnels, and utility-pipe conduit tunnels based on characteristics such as shape, size, and use. “The longest high-speed rail tunnel in South Korea is the Yulhyeon Tunnel, which is 50.25 km long and connects Suseo Station in Seoul to Jije Station in Pyeongtaek. The recently completed Boryeong Undersea Tunnel is one of the undersea tunnels, stretching to a length of 6.93 km. Finally, the most important tunnel is the utility-pipe conduit tunnel. This tunnel contains systems accommodating electricity, communication, heating, water, and conduit pipes necessary for living in the city. This tunnel is called a “lifeline” because it acts like the blood vessels that distribute energy to the body. Such tunnels are classified as national security facilities and are kept inaccessible to the general public.” Utility-pipe Conduit Accidents Leading to Large-scale Disasters A fire that broke out in the communication tunnel under the KT Ahyeon branch building on November 24, 2018 was an accident that clearly demonstrated the importance of the utility-pipe conduit tunnel. As a result of the accident, approximately 79 m of the communications tunnel on the first basement floor was burned out, and the Internet, mobile phone, and the wireless communications services provided by KT in the western area north of the Hangang River in Seoul became unavailable. “Unlike other tunnels, the utility-pipe conduit tunnel takes up space even for the internal accommodation facilities, so the space for people to move is very narrow. That was why it took so much time to extinguish the fire, which soon led to a large-scale accident. Based on the total amount of damage at that time alone, KRW 8 billion in property damage and KRW 30 billion in compensations were incurred. On the day of the accident, text messages were sent out to inform people, but no one could know why their phones were not working because the KT network was cut off.” It was called a digital disaster situation, where financial transactions and payment systems were cut off as the high-speed internet was unavailable at the time, and an elderly person in his 70s who could not report to 119 for help ended up dying due to the severance of communications. As a result, the scale and impact of direct and indirect damages in our daily life and society from an accident in the utility-pipe conduit tunnel raised the awareness that it could potentially lead to a bigger and more serious disaster than previously anticipated. Accordingly, thorough inspection and management of underground spaces including utility-pipe conduits have become much more important. “In Korea, infrastructure built during the period of economic development and growth are gradually approaching the end of their life expectancy, resulting in more frequent accidents. Such accidents can inevitably increase with aging, which has prompted us to take a closer look at practical ways to protect the safety of our citizens from such risks.” Robotic Technology Enabling Autonomous Travel and Inspection Periodic inspection is the most important means to safely manage underground space facilities. In particular, management through regular precision inspection is required. The conventional inspection method is known to have been carried out in a human-centered manner. Precision inspection is an inspection method where the inspector visually checks the damage point, then measures and records the size of the specific point using a crack gauge or crack detection microscope. In this case, it is said that it is not easy to diagnose the condition objectively because it inevitably involves the subjective judgment of the inspector. In addition, there are disadvantages in that costs are continuously required to improve safety through maintenance by increasing the frequency of inspection. The research team has developed technology for an automated inspection robot that travels inside the tunnel in the place of workers to inspect damage points on concrete structures. “The development of technology for automated inspection robots is divided into three phases: The phase of developing the core technology for each constituent technology, the phase of integration between constituent technologies, and the phase of on-site testing. In Phase 1, damage detection technology using deep learning as well as damage measurement technology using stereo vision are developed. In Phase 2, an inspection scenario according to the measurement result is implemented by linking the uncrewed moving object and the robot arm. Finally, automated inspection robotic technology is completed through on-site testing so that precision inspections can be performed in a tunnel environment.” The biggest advantage of automated inspection robotic technology is that it can be used flexibly in maintaining underground spaces based on the convergence of multiple core technologies. The robot is applied with technology for an uncrewed traveling object that can autonomously travel inside the tunnel, technology for the robot arm that can avoid complex internal accommodation facilities, and technology for the artificial intelligence sensor that can detect and measure damage points. This inspection technology was developed to also enable remote control through a wireless network, enabling convenient application by administrators. "The utility-pipe conduit is an underground lifeline; it is a tunnel that jointly accommodates communications lines, utility lines, and heating and gas pipes. In the past, tunnels and pipelines were laid in a complex urban underground system according to their respective uses, such as communications, utilities, and gas pipelines. To facilitate joint accommodation, it is essential to cut the costs of operating and maintaining utility-pipe conduits. It is expected that operation and maintenance costs can be reduced through the use of automated inspection robotic technology and that various accommodation facilities can be safely and efficiently managed within the utility-pipe conduit tunnel.” Provision of Safe and Sustainable Infrastructure The research team plans to continue its research to provide safe and sustainable infrastructure to society. The team will continue to advance this research in various forms and ultimately contribute its best efforts to the perfection of uncrewed and automated technologies for the maintenance of underground facilities. “In our future society, the aging of our population will be accelerated thanks to the extension of average life expectancy, while the economically active population will decrease accordingly. Under such circumstances, the maintenance of infrastructure relying on the workforce is expected to become more difficult. In response to these issues, we plan to develop the necessary technologies for automation and uncrewed maintenance and to further develop the technologies needed to enable automated damage repair.”
Department of Geotechnical Engineering Research
Date
2022-03-28
Hit
1343
The Current State of Cable Tension Monitoring Technology in Cable-Stayed Bridges
Senior Researcher Park Young-soo, Department of Structural Engineering Research, KICT Prologue The Special Act on the Safety Control and Maintenance of Establishments defines criteria for managing facilities, including bridges, primarily based on their scale and type, and stipulates that special bridges must be monitored and managed through precise measurements. Among these special bridges, the cable-stayed bridge is a representative cable-supported structure, in which the deck is supported by stay cables connected to towers. Cable-stayed bridges offer improved structural efficiency by combining the tensile strength of cables with the bending and compressive strength of towers and decks. They are particularly suited for long spans, but because of their aesthetic appeal, are also increasingly being adopted for shorter spans, resulting in a steady increase in the number of cable-stayed bridges in service. In such cable-supported structures, the cables are critical structural components. Their tension force and damping ratio affect not only the behavior of the cables themselves but also the overall stability of the bridge. As the main span of a cable-stayed bridge becomes longer, the stay cables linking the towers and decks become more susceptible to vibrations induced by wind and traffic loads. Since these essential cables may experience tension loss for various reasons—and such losses can significantly degrade bridge performance, potentially even leading to collapse in extreme cases—effective methods of monitoring cable tension are indispensable. Various methods for monitoring cable tension have been studied and applied. Among them, the vibration-based method estimates tension using vibration data and has the advantages of easier installation and higher cost-effectiveness compared to other methods. As of 2022, approximately 260 cable tensiometers have been installed on cable-supported bridges managed by the Special Bridge Management Center of the Korea Authority of Land & Infrastructure Safety (KALIS), and most of these monitor cable tension by estimating it through vibration-based methods that use acceleration data. Vibration-Based Method The vibration-based method for estimating cable tension involves the following procedure: 1) installing an accelerometer on the exterior of the cable to continuously collect vibration responses (Figure 2, Step #01), 2) transforming the collected responses into power spectral density (PSD) signals in the frequency domain, 3) extracting peak information (fn: peak location, n: peak order) from the transformed PSD signals (Figure 2, Step #02), and 4) deriving a linear regression equation from the extracted peak information (Figure 2, Step #03). Using the intercept b of the regression equation (0.729 in Figure 2, Step #04), together with the cable’s properties—effective length (Leff) and unit weight (w)—the cable tension is then estimated as expressed in Equation (2). Since the excitation conditions of the cable are not constant, the data collected by accelerometers installed on the cable allow for a more stable detection of peak information as the measurement time increases. However, the longer the measurement time, the longer the tension estimation cycle becomes. Therefore, in practice, acceleration measurements are generally taken at a frequency of 100 Hz, with measurement durations of 10 minutes. The collected acceleration data are then transformed into the frequency domain, and peak information (peak position and order) is detected from the transformed frequency spectrum. During the tension estimation process, the critical task of detecting peak information is mainly performed manually. For example, if data are collected in 10-minute intervals over a 24-hour period, this yields 144 data sets. If accelerometers are installed on 8 cables of a single bridge, peak information must then be detected from a total of 1,152 data sets. Because the detection of peaks is carried out primarily by a human operator, the process is labor-intensive and subject to the operator’s subjective judgment, reducing objectivity. An alternative approach to manual detection is to use pre-set conditions. For instance, peaks can be identified by detecting locations where the amplitude exceeds a threshold, or by defining frequency bands where peaks are expected and selecting the highest value within that band. However, peak information may be missing depending on excitation conditions or cable damage. In cases where the natural frequency of the cable coincides with external excitation conditions, resonance may occur, resulting in unusually large peaks in certain frequency ranges. The limitation of methods based on automatic detection of pre-set conditions is that settings must be customized for each cable specification, and changes in spectral characteristics can hinder the accurate detection of peak information. IoT Measurement System with Automatic Peak Detection Algorithm The vibration signals of cable-stayed bridge cables, when transformed into the frequency domain, generate a power spectral density (PSD) that exhibits two distinct characteristics, as shown in Figure 3. First, the peaks in the cable PSD display a periodic pattern occurring at uniform intervals, reflecting the inherent dynamic properties of the cable. While the spacing of these peaks can vary depending on the cable’s specifications (such as material, geometry, and tension) and the overall structural system, periodicity with consistent intervals is a physical feature common to all cable members in cable-stayed bridges. The second characteristic is that the peaks have relatively higher amplitudes compared to surrounding frequency components. This means that, in the PSD, these peaks behave as outliers compared to neighboring values (Jin et al., 2021). To automatically detect such uniform peak intervals, one can apply the Automatic Multiscale-based Peak Detection (AMPD) technique, a biosignal processing method from the field of Biomedical Engineering (BME) (Scholkmanm et al., 2012). AMPD has the advantage of enabling complete automation because it can automatically detect periodically occurring peaks without any pre-configuration. To capture the second characteristic—where peaks appear as outliers compared to surrounding values—a threshold-based outlier detection method can be used in parallel. In this case, the threshold can be set using the Median Absolute Deviation (MAD) method, which is robust to data containing outliers (Rousseeuw et al., 1993). Based on the peak information estimated using these two techniques, the cable tension is calculated. This technology offers several advantages: (1) there is no need for pre-configuration, (2) it has a high robustness against signal variations, and (3) there is a low computational cost. Acceleration data for cable tension monitoring are mainly collected through wired measurement systems. In these systems, the sensors are connected to the data acquisition devices with cables, and the collected data are transmitted to the managing authority for use in tension analysis. Wired measurement systems have the advantage of enabling stable measurements without data loss; however, they involve additional costs due to the need for cabling between sensors and loggers as well as the installation of protective conduits to prevent disconnection, and they are limited in terms of installation locations and the number of sensors that can be deployed. In recent years, various IoT (Internet of Things)-based measurement systems have been developed and applied to facilities. However, most of them, like traditional wired systems, remain at the level of simply collecting and transmitting data. While this offers advantages in terms of installation flexibility and scalability, it does not fully utilize the potential strengths of IoT technology. IoT measurement systems can incorporate diverse algorithms to filter and process raw data before its transmission, rather than sending the raw data itself. This edge computing technology processes data in real time at the sensor terminal or adjacent devices, reducing the burden of transmission to servers and lowering both processing costs and time. By installing the previously described automatic peak detection algorithm on an IoT-based measurement system and applying it to cable-stayed bridge cables, a study was conducted to verify the algorithm’s accuracy, as well as the usability and efficiency of the measurement system. Through this research, the potential of applying IoT measurement systems and edge computing technologies to facility monitoring was confirmed. Epilogue The integration of IoT measurement systems with edge computing makes it possible to move beyond the traditional approach of transmitting large volumes of raw data to servers for collection and analysis, enabling on-site data processing and optimized management. With the advancement of data processing and analysis technologies now embedded into IoT measurement systems, the scope of data utilization in facility maintenance—which was previously limited to raw data transmission—is expected to expand significantly. In addition, with the advent of real-time processing, it is now possible to respond immediately rather than after the fact, making preventive maintenance achievable. This not only helps prevent safety accidents but also is expected to reduce both direct and indirect social costs. References 2024 Road Bridge and Tunnel Status Report. Jin et al. (2021), Fuly automated peak-picking method for an autonomous stay-cable monitoring system in cablestayed bridges, Autom. Constr. Vol. 126. Scholkmanm et al. (2012), An efficient algorithm for automatic peak detection in noisy periodic and quasiperiodic signals, Algorithms, Vol. 5. Rousseeuw et al. (1993), Alternatives to the median absolute deviation, J. Am. Stat. Assoc. Vol. 88
Department of Structural Engineering Research
Date
2025-09-24
Hit
43
Development of 3D Printing Materials for the Automation of Underwater Construction
Development of 3D Printing Materials for the Automation of Underwater Construction ▲ Research Specialist Seoh Eun-a and Senior Researcher Lee Ho-jae, Department of Structural Engineering Research, KICT Prologue In 2024, the World Meteorological Organization (WMO) announced through its "State of the Global Climate 2023" that global sea levels have been rising at a rate of 4.77 mm annually over the past decade, more than twice as fast as previous periods, while average sea surface temperatures reached record highs. With 40% of the world's population living within 100 km of coastlines, these rising sea levels mean that people are facing immediate challenges in securing living spaces and survival. As the need to secure marine resources and expand living areas increases, demand for coastal spaces is growing, with development expanding into underwater spaces. In Guam, Dubai, and the Maldives, underwater hotels and resorts have been built at depths of 5-6 meters, and are currently operational. In Korea, Hyundai E&C and the Korea Institute of Ocean Science & Technology (KIOST) have formed a consortium to build an underwater science base in the sea off Ulju-gun, Ulsan, with completion targeted for 2026. Furthermore, the development of new underwater construction technologies is expected to increase the construction of facilities for rapid recovery from natural disasters such as typhoons and earthquakes, which are becoming intensified by abnormal climate conditions, as well as preventive facilities from a disaster prevention perspective. Although demand for underwater structures is increasing, practical difficulties exist in the construction and quality control of underwater projects. In particular, the underwater construction field faces increasing safety risks due to a shortage of divers and the aging of the existing diver work force, creating a growing demand for underwater construction automation technologies. There is also an increasing demand for automation technologies for the repair and reinforcement of various underwater structures, such as water intake and discharge structures, dams, and underwater portions of bridges. When constructing underwater structures, high-performance structural and material technologies that can withstand water pressure are essential, and there also are challenges related to weather conditions. To overcome these environmental challenges, the application of technologies that minimize diver deployment through the use of underwater robots is expanding. Underwater robots can work even in strong currents, solve problems that are difficult for humans to address underwater, and improve the accuracy of construction through real-time filming and sensing technologies. KIOST opened the Underwater Construction Robotics R&D Center in 2013 in response to social demands for underwater construction automation. This R&D Center developed robotic technologies for six years until 2019, and pursued demonstration and dissemination projects for four years until 2022. In particular, the Underwater Construction Robotics R&D Center developed three types of robots: a light-duty swimming ROV (Remotely Operated Vehicle), a heavy-duty swimming ROV, and a track-based robot for underwater welding, subsea cable burial, underwater structure installation, and pipeline burial work. Due to the absence of on-site construction technology for underwater structures, 3D printing technology for underwater construction emerged as an automation solution to address this technical gap, as construction 3D printing technology is known to be applicable in extreme environments like space habitat creation. With recent global initiatives for underwater city development and the construction of offshore structures connected to underwater environments, research on underwater construction 3D printing technology is expanding worldwide. This article briefly discusses the current status and direction of development of 3D printing materials for underwater construction automation. Required Performance of 3D Printing Materials for Underwater Construction Concrete is a material that requires sufficient flowability to fill formwork properly. However, materials for 3D printing need to have the opposite characteristics—they must maintain their shape after extrusion, and resist deformation from external forces as they are continuously stacked. Generally, construction 3D printing technology consists of three stages: production, pumping, and printing. Since cementitious materials decrease in flowability and harden over time, material development must be aligned with the entire system, from production to printing. If materials harden too quickly, blockages can occur inside the equipment; on the other hand, if flowability decreases too slowly, the materials will not stack properly. Because cementitious materials are difficult to control even with subtle changes in raw materials and are sensitive to temperature and humidity changes, the development and property control of construction 3D printing materials is the most difficult and critical technology. Concrete is a mixture of cement, water, sand, and gravel, taking at least 8 hours to harden after mixing. Since components can be washed away when in contact with water before hardening, placing concrete underwater presents technical challenges. For underwater construction 3D printing materials, printability, stackability, dimensional stability, and dynamic performance are key. The transportation and printing performance of 3D printing materials can be quantified through flowability and rheology evaluation, and the application of undersegregation water anti-cementitious materials is essential. Generally, to ensure layer stackability and dimensional stability, a method of adjusting the nozzle movement speed (stacking speed) according to the stacking path is used. Most construction 3D printing materials use mortar, a mixture of water, cementitious materials, and fine aggregates. For 3D printing technology to be practically usable, faster printing speeds than current mortar 3D printing technology are required, as mortar 3D printing has limitations when it comes to improving the one-time printing area of a layer. However, 3D printing materials mixed with coarse aggregates have an advantage in that the coarse aggregates within the layers provide support and friction, making it easier to increase layer height. Accordingly, research on technologies applying coarse aggregates to aerial and underwater 3D printing for construction has been expanding globally since 2020. Performance Verification of 3D Printing Technology for Underwater Construction From 2020 to 2022, the Korea Institute of Civil Engineering and Building Technology (KICT) conducted research on "Development of Concrete Composite Materials for Underwater Stacked Placement." Through this research, concrete composite materials with an underwater stacked compressive strength of 30 MPa or more and an underwater/aerial compressive strength ratio of 80% were developed, along with underwater concrete stacking experimental equipment capable of achieving a single layer height of 50 mm and a layer width of 100 mm. The developed underwater construction 3D printing technology underwent performance verification experiments in a large water tank and at the KICT's breakwater testing facility. Concrete specimens were produced under identical conditions in both underwater and aerial environments using the developed underwater construction 3D printing technology, and layer width and height, total height of the stacked structure, and compressive strength were measured. In a static water tank environment, the underwater stacked concrete achieved a compressive strength of 62.8 MPa, which was 99% of the aerial compressive strength. The underwater printed components had a layer width of over 100 mm, a stacking thickness of 52.9 mm, and a deflection relative to the total height of the component of only 1 mm, demonstrating high dimensional stability (Figure 1). In addition, the performance of the underwater 3D printing material was evaluated under conditions simulating the average flow velocity of Busan New Port at the KICT's breakwater testing facility. During the printing stage, there was minimal separation of the 3D printing material, which maintained its shape during printing and achieved the target turbidity standard of 50 mg/l (Figure 2). Through these tests, it was confirmed that direct construction of structures using 3D printing technology is possible in underwater and current environments. Epilogue Underwater construction 3D printing technology is poised to become a key proprietary technology in the evolving field of construction convergence, with potential applications in extreme underwater environments like underwater cities and deep-sea bases. However, before it can be widely implemented in underwater construction projects, several practical challenges must be addressed. Currently, the technology shows promise in several areas, including creating artificial reefs tailored to support the growth of seaweed and shellfish, manufacturing custom replacement parts for damaged underwater structures, and building underwater structures to prevent coastal erosion. Furthermore, the development of repair and reinforcement technologies could lead to automation in underwater structure maintenance. With continued advancements, underwater 3D printing technology is expected to play a significant role in the repair and construction of underwater structures, opening the door to more efficient and scalable solutions in the field. References World Meteorological Organization (2024) State of the Global Climate 2023, 1347, 3-7. Korea Institute of Marine Science & Technology Promotion (KIMST) under the Ministry of Oceans and Fisheries (2023), Final Report on the Development of Concrete Composite Materials for Underwater Stacked Placement
Department of Structural Engineering Research
Date
2025-03-26
Hit
510
Special Bridge Safety Inspection Technology Utilizing Robots
Special Bridge Safety Inspection Technology Utilizing Robots ▲ Senior Researcher Seo Dong-woo, KICT Department of Structural Engineering Research Prologue Most of the structures currently constructed as special bridges in Korea (collectively referring to cable-stayed bridges on which the measurement system is built) are constructed in the form of cable-stayed bridges or suspension bridges. Since the service life required for special bridges is more than 100 years, the stability, durability, and usability of the structure must be secured (KSCE, 2006). Damage to cables, which is one of the key deficiencies in special bridges, is a major factor reducing bridge safety and shortening service life. Cable damage is caused not only by environmental factors (climate, load, earthquake, etc.) but also by unpredictable accidents such as fire or collision. If a bridge in public use must suspend its operation due to cable damage, the economic and social losses are enormous (Na et al., 2014). In Korea, there was an accident in which one out of a total of 144 construction materials was completely broken and two were partially damaged by a cable fire at Seohae Bridge (cable-stayed bridge) (Gil et al., 2016). Although studies aiming to develop various inspection technologies for the safety and maintenance of cables are being conducted, there is a limit to the applicability of these technologies to special bridges, especially to cables, which are large facilities, due to limitations in the mobility and accessibility of equipment. To address this, efforts to develop a cable inspection robot capable of non-destructive testing are ongoing (Kim et al., 2014). To apply the inspection robot to cables, it is necessary to secure its field usability by using a wireless system and minimizing dead-weight. In this article, I would like to introduce a cable inspection robot equipped with an electromagnetic sensor to improve the driving stability, which was pointed out as a disadvantage of existing inspection robots, and to detect whether the inside of the cable is damaged. Design and Specifications of Cable Inspection Robot In making the cable inspection robot, we focused on the applicability of large diameter cables over 200 mm and securing the robot's driving stability. Figure 1 shows the 3D image of the cable inspection robot and its main devices. The dimensions of the robot are 510 mm × 610 mm × 710 mm, and the weight is reduced to 12.8 kg. In addition, to improve durability, the frame of the robot was made of aluminum. A high-resolution IP camera (1920 × 1080 pixels) was installed to take pictures of the exterior of the cable, enabling real-time cable shot images to be transmitted with a wireless Wi-Fi router. Furthermore, the movement distance of the robot could be calculated using an acceleration sensor and a rotary encoder. Three driving motors (IG-32GM, DC12) and urethane wheels were installed so that the robot can move on the cable while minimizing its shaking during climbing. In addition, a variable diameter adjustment part (140-300 mm) was made to improve the adhesion between wheel and cable. The wireless remote control of the robot uses IEEE 802.11 an/ac 5 GHz 2×2 MIMO to achieve a communication distance of 10 km and a data transmission rate of up to 867 Mbps. Damage to the steel wire of cables is detected with an electromagnetic sensor. As shown in Figure 2, the principle applied is that the polarity is divided again at the damaged area when the cable breaks or gets damaged. As shown in Figure 3, the sensing device mounted on the inspection robot for cable damage detection consists of pipe diameter adjusting units that can be adjusted according to the cable diameter and a roller for moving on the cable surface. Also, the electromagnetic sensor for detecting cable damage is inserted in the middle of the roller part. Performance Evaluation of Cable Inspection Robot Indoor and outdoor tests to evaluate the driving performance of the cable inspection robot were conducted as shown in Figure 4. One cable-stayed bridge with a history of cable accidents was selected as a test bed bridge for field tests of bridges currently in public use. The bridge is a short-span earth-anchored steel composite cable-stayed bridge with a span length of 400 m and a width of 23.9 m, on a four-lane road (two ways). The field cable (200 mm) had an inclination angle of 27.3 degrees, and the indoor test was conducted at 45 degrees. With the verification test, the climbing speed (19 cm/s) and the descent speed (20 cm/s) were evaluated, and it was confirmed that the robot is effectively controlling its speed when the speed increases due to slipping that may occur during the descent. It was also confirmed that the driving speed was constant regardless of the inclination angle. In addition, real-time images of the cable surface were taken with three cameras in the field test, and as shown in Figure 5, it was confirmed that visual inspection of the cable was possible. No communication-related problems occurred during the performance verification test. The cable damage detection test was conducted indoors. The cable specimen used in the indoor test is a type of cable currently used in bridges, and the inner cable consists of 20 pieces of one bundle composed of seven 1.57 mm strands. For the cable sheathing, the same High-Density Polyethylene (HDPE) tube used in the driving capability test was used. To detect cable damage, damage types were artificially simulated as shown in Figure 6. Cut damage was subdivided according to the degree of cross-sectional cut into 30%, 50%, and 100% cut (break). For disengagement damage, the case where the cable protruded to the outside in a tidy state was reproduced. For disconnection, one cable was made short. Figure 7 shows the results of the test conducted indoors. In the graph, the X-axis is time and the Y-axis is the electromagnetic sensor measurement. It can be seen that the phase of the electromagnetic sensor measurement changed by 180 degrees at the point where damage (cut) took place. On the other hand, it was confirmed that the phase of the electromagnetic sensor measured value did not change during disconnection, but the magnitude of the magnetic field increased. To secure the reliability of the experimental results, it is considered that additional experiments are needed, with more diverse damage types and repeatability than those conducted in this study. Epilogue This article introduced the development of a cable inspection robot capable of measuring large-diameter cables over 200 mm. The developed cable inspection robot has expanded its field applicability by improving its driving ability, driving stability, and wireless communication performance. The possibility of detecting damage to the inside of the cable using an electromagnetic sensor was verified through an indoor test. However, it is considered necessary to further improve inspection efficiency by developing an analysis algorithm that in addition to detecting the presence of cable damage can determine the degree and type of damage through additional tests. If facility maintenance technology using inspection robots is continuously advanced and applied, it is expected that it will greatly contribute to facility safety management. This cable inspection robot was developed with budget support by the Ministry of Land, Infrastructure, and Transport. It has been handed over to the Korea Authority of Land & Infrastructure Safety and is being used for the maintenance of general national highway special bridges.
Department of Structural Engineering Research
Date
2022-09-27
Hit
1115
Development of Nondestructive Evaluation Technology for PSC Structures (PSC Stethoscope)
Development of Nondestructive Evaluation Technology for PSC Structures (PSC Stethoscope) ▲ Senior Researcher Park Kwang-yeun, KICT Department of Structural Engineering Research The Aging of PSC Structures and Need for External PS Tendon Nondestructive Testing Whether at home or abroad, in countries where civilization has progressed rapidly, a number of bridges containing the essence of civil engineering technology have been built, allowing logistics and passengers to quickly cross rivers and valleys. In South Korea as well, befitting a civilized country, many bridges have been built and are playing numerous roles. These bridges enable convenient crossing of the Han River to bind the Gangbuk and Gangnam areas into a single city, overcome mountain valleys to greatly increase accessibility to mountainous regions, and connect islands to the mainland. It is found that 38% of these bridges were built using pre-stressed concrete (PSC) structures. Given the fact that a large number of bridges have been built since the 1980s and 1990s when Korea's economy grew rapidly, it can be assumed that the development of safety diagnosis technology for PSC structures older than 30 years is urgent. As the name suggests, the pre-stressed tendon (PS tendon) plays the most critical role in the PSC structure. PS tendons can be broadly classified into external PS tendons and internal PS tendons. For example, regarding external PS tendons, there was a case of enormous economic and social loss in 2016 due to corrosion of external PS tendons on Jeongneungcheon Viaduct, the inner ring road in Seoul, raising public awareness of the need for safety diagnosis (Figure 1). State of External PS Tendon Nondestructive Testing Technology Taking the Jeongneungcheon Viaduct case as an opportunity, the Korea Institute of Civil Engineering and Building Technology (KICT) conducted the KICT Blind Test (2016), targeting domestic and foreign nondestructive testing technologies to investigate the technology that can assess the integrity of external PS tendons. The integrity of the external PS tendon can be checked using three indicators: sectional damage, stress, and voids. However, for stress, no organization possessed the related technology, regardless of location at home or abroad, and for voids, only one French company (Advitam) applied for and demonstrated a detection rate of about 73%. Among the three indicators, cross-sectional damage is the most important and direct indicator. Of the ten local and foreign companies that applied for related nondestructive technology, only two companies, Tokyo-Rope of Japan and Instron of Russia, showed valid results, and none of the Korean companies demonstrated valid results. As for the technology of the two companies, which showed valid results, we came to the conclusion that it would be difficult to apply it in the field unless the cost, usability, size, and weight of equipment were improved. Development of Nondestructive Evaluation Technology for PSC Structures (PSC Stethoscope) For this reason, the KICT initiated a study to develop a proprietary technology that can inspect cross-section damage, stress state, and voids by conducting nondestructive testing of external PS tendons. The cross-sectional damage and stress use the magnetic properties of the external PS tendon made of metal, and the presence or absence of voids is inspected by applying radar technology. In this article, I would like to briefly introduce a technology for nondestructive testing of sectional damage, which is the most important indicator to assess the integrity of PS tendons. Underlying Concept of Nondestructive Testing Sensor Figure 2 shows the conceptual diagram of the developed electromagnetic sensor installed on the external PS tendon. Although the external PS tendon (the red-brown part in Figure 2) is actually paved with ducts and grouts, the magnetic properties of the duct and grout are almost the same as that of air (or vacuum). Therefore, it can be assumed that there is no magnetic property. The electromagnetic sensor is largely made up of three parts: the primary coil (yellow part in Figure 2), the secondary coil (orange part in Figure 2), and the fixing frame (purple part in Figure 2). The fixing frame is made of plastic that does not respond to magnetic fields. The primary coil is a kind of electromagnet that generates a magnetic field inside the sensor by flowing electricity, and the magnitude of the generated magnetic field is a function of the cross-sectional area of the external PS tendon, a metal component that penetrates the inside of the sensor. The secondary coil is wound to wrap the external PS tendon several times, and if the magnetic field inside the sensor is changed by varying the current applied to the primary coil, an induced current proportional to the magnetic field change is generated in the secondary coil. Using this principle, when AC electricity having a sine wave shape of constant amplitude is passed through the primary coil, AC electricity having an amplitude positively correlated with the cross-sectional area of the external PS tendon is induced in the secondary coil. Therefore, the cross-sectional area of the external PS tendon can be estimated by analyzing the amplitude of the induced AC electricity. The cross-sectional area of the metal component decreases when the external PS tendon is broken or rusted (iron oxide does not respond to a magnetic field). So, it is possible to estimate corrosion and break from the reduction in the cross-section. Development of Sensors Optimized for Field Work As can be seen from Figure 2, the sensor using this principle should have a closed circuit that wraps the external PS tendon. Tokyo-Rope of Japan and Instron of Russia, who were introduced earlier, also share the concepts and basic ideas mentioned above (of course, if you look at the details, they are quite different). However, Japanese and Russian technologies require winding work or equivalent work at the site, as shown in Figure 3, to make a closed circuit wrapping the external PS tendon, which takes a considerable amount of time. Consequently, workability is poor. In addition, since the sensor condition changes every time it is installed, the reliability of the sensor is lowered, and it is disadvantageous to work in the narrow passageway inside the bridge because all the sensor parts must be carried separately to be moved. On the other hand, the electromagnetic sensor developed by the KICT is divided into two, as shown in Figure 4, so with a little mastery, it can be installed within one to two minutes. Furthermore, it was ensured that the reliability of the sensor does not decrease, no matter how many times it is repeatedly installed, by composing the main junction with a highly reliable ready-made connector. The total weight is 5 kg and each side weighs about 2.5 kg, so it is not too heavy for a person to carry. If this sensor is installed as shown in Figure 5 and scanned at an appropriate speed along the external PS tendon, the change in the cross-sectional area can be inspected by performing a nondestructive test for the concerned section. Decision-making Technology Using Signal Processing and Artificial Intelligence Figure 6 shows the results applied to the specimens made to test the developed non-destructive equipment. The cross-sectional area simulating the damage as well as the damaged section are schematized at the top of the Figure. The result, measured by the same process as in Figure 5, is shown as the green line in Figure 6, but it is difficult to distinguish with the naked eyes because the amplitude change is insignificant. When the measured signal goes through several stages of signal processing, such as amplitude demodulation, to help assess the integrity of the external PS tendon using the measurements from the magnetic sensor, the result shown in the red line in Figure 6 can be obtained. In the red line, it can be seen that the change according to the damage to the PS tendon is clearly distinguished. However, a lot of experience is needed to distinguish whether these changes are caused by damage or noise. In addition, it is difficult to obtain information about the extent of the damage. To solve this problem, we developed an algorithm that uses a shallow FRP nerve sensor to specify the location of the damage, as shown in the blue dot in Figure 6, and predicts the ratio of the damage cross-section and even the length of the damage. Moreover, a number of specimens, as shown in Figure 7, were made and used to study artificial intelligence. Epilogue The KICT has developed a technology for nondestructive testing of the external PS tendon, a major element of the PSC structure, to prevent situations such as the Jeongneungcheon Viaduct that occurred in 2016 from being repeated. This technology uses the principle of nondestructive testing of the cross-sectional area made of metal with the application of electromagnetism and enables the repair and reinforcement of the PSC structure by detecting breaks and corrosion of the external PS tendon in advance. We not only developed sensors but also developed technology to help decision-making by improving the usability of sensors and applying signal processing and artificial intelligence to measured signals. The usability of the sensor is continuously improving through close communication with the companies currently in demand. Also, in the case of signal processing and artificial intelligence to help decision making, the algorithm is being enhanced and the accuracy is increased by adding learning data. We are also developing technology for the nondestructive testing of cables in cable bridges using the same principle. If the technology introduced here is completed and enters the bridge maintenance market, it will be possible to prevent huge economic losses through preemptive maintenance of bridges and to help avoid social losses caused by inconvenience to many people.
Department of Structural Engineering Research
Date
2022-06-27
Hit
829
Core Solution for the Era of Fully Autonomous Driving: Physical Infrastructure Supporting Autonomy
Senior Researcher Kim Young-min, Department of Highway and Transportation Research, KICT Prologue To operate independently, autonomous vehicles (“AVs” hereinafter) must be capable of perceiving and interpreting their surroundings. In essence, they need to perform the same sequence of actions that human drivers carry out—Perception–Identification–Emotion–Volition (PIEV). To achieve this, AVs must be equipped with systems and performance capabilities that support this sequence. For AVs, the functions that parallel the human PIEV process are recognizing the driving environment and controlling the vehicle based on that recognition. The environment they must process includes not only the fundamental road layout (e.g., horizontal and vertical alignment, lane configuration) but also dynamic, real-time information, such as the presence and movement of other road users (vehicles, pedestrians, etc.) and the traffic regulations governing road use. Up to now, road infrastructure systems have been developed and operated with human drivers as the primary consideration. To achieve the commercialization of fully autonomous driving technology, it is essential to re-examine road infrastructure systems with AVs as the primary consideration. The Korea Institute of Civil Engineering and Building Technology (KICT) has pursued various R&D initiatives around strengthening the role of road infrastructure in the age of autonomous driving (for related content, see the Spring 2025 special feature “Future Road Development for Cooperative Autonomous Driving”). This article introduces the Physical Infrastructure Supporting Autonomous Driving currently being developed at the KICT. Background and Purpose of Technology Development To realize fully autonomous driving—defined as Level 3 or higher under the SAE (Society of Automotive Engineers) standards, where control authority shifts from the human driver to the vehicle—it is essential to combine advanced AI-based environmental perception using onboard sensors with technologies that link static and dynamic information from high-definition road maps, known as the Local Dynamic Map (LDM). Together, these technologies enable vehicles to perceive their surroundings with high-precision positioning. This approach represents the core concept of cooperative autonomous driving, in which infrastructure supports autonomous vehicles in carrying out driving tasks. To make this vision a reality, various forms and methods of infrastructure support have been proposed (see Figure 1). Let us return to the perspective of human driving behavior. The information a driver uses to perform driving is more extensive than commonly assumed, and the cognitive processes involved in decision-making are highly complex. For example, the act of lane changing stems from several decision-making factors and resolutions. This includes decisions such as recognizing that the current lane is more congested than an adjacent lane and deciding to change lanes, determining that the lane ahead is blocked due to construction or other reasons and therefore a forced lane change is unavoidable, or choosing to move into a lane closer to the intended direction in order to make a left or right turn at an intersection. At a deeper level, driving involves collecting “evidence” for each decision, followed by “reasoning” to reach the final judgment. In short, the decision-making process required for driving combines sensory inputs—such as visual recognition of an obstacle’s shape or auditory recognition of a horn—with prior driving experience and accumulated know-how in situational judgment. AVs must carry out the same processes as human drivers. At this point, the role of road facilities—referred to in this article as “physical infrastructure supporting autonomous driving”—is revealed. Because sensor-based perception systems have inherent limitations, AVs are currently required to transfer control authority back to the driver in what are commonly called “handicap situations and zones” (Jeon and Kim, 2021). Representative examples include reduced visibility due to weather conditions such as fog, which makes it difficult for vision sensors to collect information, and lane closures caused by roadwork; these are classified as typical “autonomous driving handicap situations and zones.” If “physical infrastructure supporting autonomous driving” can provide support in such “handicap situations and zones” by contributing to the “decision-making process,” more specifically to the “evidence collection process for decision-making” and to “reasoning using decision evidence,” it can offer practical and meaningful assistance for AV operations. The implementation of “physical infrastructure supporting autonomous driving” can be broadly categorized into two types. The first involves enhancing existing road facilities so that they are more easily detected by AV sensors. In practice, this means improving the sensor-based perception performance of road facilities—while preserving their inherent functions and properties—by accounting for the characteristics of key vehicle sensors used for environmental perception (e.g., cameras, LiDAR). Examples include adjusting the color or material of facilities within existing regulatory limits, or making structural modifications that expand sensor-detectable areas without altering their outward appearance. The second type involves leveraging the physical properties of road facilities to provide the AV with information that can serve as more reliable evidence in its reasoning process. For instance, facilities shaped like conventional traffic signs can display encoded information that AV sensors can detect and interpret, thereby delivering critical road operation data for vehicle control. This approach can be viewed as equipping AVs with functions equivalent to those that road facilities provide for human drivers—such as traffic regulation signs that indicate required actions, or guide signs and safety facilities that offer useful reference information while driving. Development and Verification of Physical Infrastructure Supporting Autonomous Driving: Focus on Lane-Closure Sections In 2024, the research team developed a prototype AV (see Figure 2). Although it is just one of many AVs designed and manufactured in South Korea, this vehicle has a unique function: it enables “vehicle control and autonomous driving through physical infrastructure support.” By incorporating physical infrastructure into vehicle control, the research team compared AV perception performance in “handicap situations and zones,” as well as vehicle behavior with and without infrastructure in those conditions. This made it possible to verify the suitability of the physical infrastructure system for autonomous driving. Every day, countless events unfold on the road. Among them, one of the most critical situations directly affecting vehicle operation is the lane closure. Lane closures often occur due to road maintenance or accident response, and vehicles must detour around the closed lane in order to continue driving. Human drivers recognize and interpret lane closures through multiple cues—for example, visually confirming traffic control devices such as cones or guard barriers, observing hand signals from traffic controllers like police officers or flaggers, or noticing forced merges of preceding vehicles. AVs, however, have clear limitations in carrying out such reasoning and judgment processes. Given that lane closures are highly dynamic and variable on roadways, it is expected that map-based electronic information systems alone will not be sufficient to provide reliable information in these situations. The research team devised a system that enables AVs to more easily recognize lane-closure situations by utilizing “encoded signs” that can be detected through road facilities (see Figure 3). In lane-closure sections, the vehicle must perform lateral control, which consists of two tasks: avoidance control, where the vehicle detours around the closed lane, and return control, where the vehicle decides whether to return to its original lane after passing the closed section, depending on the requirements of the global driving path. To achieve this, the team applied a technology that recognizes point cloud data (PCD) patterns obtained through in-vehicle LiDAR, enabling AVs to detect lane-closure situations via road facilities and incorporate this information into vehicle control. This approach takes advantage of LiDAR’s greater robustness under adverse weather conditions (e.g., heavy rain, fog) compared to vision sensors, thus addressing the “visibility obstruction” handicap situation that cannot be easily resolved by simply improving conventional vision sensor–based perception (Kim et al., 2024). The following are the speed and angular velocity values measured inside the AV when passing through a lane-closure section, both without and with the installation of physical infrastructure supporting autonomous driving. This experiment was conducted by recreating a lane-closure environment at the Yeoncheon SOC Demonstration Center and observing how the vehicle’s behavior differed depending on the presence or absence of physical infrastructure. When the AV recognizes the lane-closure section, lane-change control is performed, during which the vehicle reduces speed to an appropriate level and executes a turning maneuver to change lanes. In this process, if physical infrastructure that provides lane-closure guidance exists, the AV can recognize the lane-closure section in advance. Compared to abrupt maneuvers such as sudden deceleration or sharp turns—often carried out by AVs when facing unexpected physical situations that make normal driving difficult—this advance recognition induces smoother driving. Numerically (see Figure 4), without the use of lane-closure guidance infrastructure, the AV reduced its speed by up to 20 km/h when changing lanes, with angular velocity reaching a maximum of 0.15 rad/s. In contrast, when physical infrastructure was utilized, the AV reduced its speed by only up to 10 km/h to pass through the section, and its maximum angular velocity remained within 0.10 rad/s, confirming quantitatively that more stable driving was achieved. The results of this experiment indicate that the physical infrastructure supporting autonomous driving not only has positive effects on AVs themselves but can also generate even greater benefits in situations where AVs and conventional vehicles coexist. From a traffic flow perspective, large fluctuations in the speed and angular velocity of an individual vehicle make the vehicle a so-called “troublemaker” that disrupts overall traffic stability. The function of physical infrastructure that ensures AVs are controlled so that they do not behave in ways that appear unusual compared to human drivers contributes to improving the stability of mixed traffic flow involving both AVs and conventional vehicles, and is therefore expected to positively influence the broader adoption of AVs. Epilogue As of 2025, many experts believe that autonomous driving technology is currently in a stagnation phase of development and diffusion known as the “Chasm.” In the early 2010s, when Google first unveiled its autonomous vehicle to the public, most countries had set targets for the commercialization of autonomous driving that were earlier than 2020. Today, in the mid-2020s, only a very limited number of production vehicles equipped with autonomous driving functions at SAE Level 3 or higher—a recognized milestone for commercialization—actually exist, and even these are constrained to operating only within various limitations defined by their Operation Design Domain (ODD). This reality implies that there are significant technological challenges that must be solved before we reach the era of fully autonomous vehicles, and at the same time highlights the need for new methodologies and approaches. Various R&D cases conducted thus far demonstrate that cooperation between vehicles and infrastructure is indispensable for the commercialization of fully autonomous driving. The methodology introduced by the research team in this article—namely, constructing an environment in which AVs can more actively utilize road facilities during the driving process and applying this approach to alleviate the difficulties of AV decision-making and control in “handicap situations and zones”—is expected to serve as a core solution that can accelerate the advent of the fully autonomous driving era. References Kim, Young-min; Park, Beom-jin; Kim, Ji-soo (2024). A Study on the Development and Verification of Infrastructure Facilities Supporting AV Positioning Using Mobile LiDAR. Journal of The Korean Society of Intelligent Transport Systems, Vol. 23, No. 6, pp. 203–217. Jeon, Hyun-myung; Kim, Ji-soo (2021). Analysis of Handicap Situations and Their Causes in Autonomous Vehicles through IPA and FGI. Journal of The Korean Society of Intelligent Transport Systems, Vol. 20, No. 3, pp. 34–46. Korea Intelligent Transport Systems Consortium (2024). Stage Report on the Development of a Digital Road and Traffic Infrastructure Convergence Platform Based on Crowdsourcing.
Department of Highway & Transportation Research
Date
2025-09-24
Hit
64
No more carbon emissions! The era of Carbon dioxide-eating concrete is here!
No more carbon emissions! The era of Carbon dioxide-eating concrete is here! - Evelopment of carbon dioxide-storing concrete technology utilizing CO2 nanobubble mixing water - CO2storage capacity of 1.0ᅳ1.8 kg per 1 ㎥ ready-mixed concrete The Korea Institute of Civil Engineering and Building Technology (KICT) has become the first Korean organization to develop "Carbon Eating Concrete (CEC) using Nanobubbles," a groundbreaking technology that stores carbon dioxide (CO2)—a major contributor to global warming—within concrete using nano-bubbles. Concrete is the most widely used artificial material worldwide, with an annual production volume of approximately 30 billion tons. As demand for urbanization and infrastructure grows, so does concrete usage. Despite being a single material, the process of concrete production (including cement manufacturing) accounts for about 5% of global greenhouse gas emissions due to the significant CO2 emissions involved. "Carbon Capture Utilization for Concrete (CCU Concrete)" technology is concrete produced by utilizing CO2 in a manner that does not impact climate change. In a paper published in Nature Communications in 2021, it was estimated that CCU concrete could theoretically sequester 0.1ᅳ1.4 Gt of CO2 by 2050. CCU concrete is recognized as the only technology capable of mineralizing captured CO2 through reaction with concrete, thereby storing CO2 stably inside the material without re-releasing it into the atmosphere. Typically, concrete undergoes carbonation when exposed to atmospheric CO2 lowering its internal pH and losing alkalinity. While atmospheric CO2 concentration is very low at 400 ppm, causing this carbonation process to proceed extremely slowly, it puts the reinforcing steel surrounded by low-durability concrete at an increased risk of corrosion. However, CCU concrete technology intentionally induces a reaction between high-concentration CO2 and the internal concrete materials. Through this chemical reaction, the CO2 is converted into carbonate minerals that enhance strength, permanently storing it within the concrete. Consequently, these carbonate minerals increase the microstructural density, enabling the production of concrete with improved strength and durability compared to conventional concrete. In other words, CCU concrete is not merely a CO2 storage solution but offers additional benefits like enhanced concrete performance and reduced cement usage, indicating significant market potential. The research team at the Department of Structural Engineering Research of the KICT has thus developed the first "Carbon Eating Concrete (CEC)" in Korea, which can effectively absorb and store carbon dioxide in concrete structures while simultaneously improving concrete's compressive strength and durability using nanobubbles. Concrete is traditionally manufactured by mixing cement powder, water, and aggregate. The research team developed CO2 nanobubble water, which is capable of storing high-concentration CO2 even under standard atmospheric conditions. "CO2 nanobubble water" is water containing numerous nanobubbles with high CO2 dissolution. The developed technology utilizes CO2 nanobubble water and industrial by-products in concrete production instead of regular mixing water. Advanced analytical techniques (Raman spectroscopy) verified the chemical interaction between CO2 in nanobubble water and concrete. The developed technology allows the direct storage of 1.0-1.8 kg of CO2 per 1 m³ of concrete production, comparable to the CO2 storage volume achieved by "Carbon Cure," a world-leading direct injection technology company from Canada. In addition, the research team developed "CEC" by applying optimal temperature and humidity conditions and mixing techniques using high CO2-reactivity industrial by-products to reduce cement usage. The developed CO2curing technology can maximize concrete's physical performance while minimizing the amount of cement required. Compared to traditional steam curing, it consumes less energy during production and achieves equivalent or superior compressive strength through CO2 curing techniques. A significant advantage is its high CO2 storage efficiency. To simulate CO2 curing environments under various temperature and pressure conditions, the team established Korea's largest high-temperature, high-pressure CO2 curing system for concrete. This achievement was developed through the major KICT project "Development of Eco-Friendly Carbon Eating Concrete (CEC) Manufacturing and Utilization Technology (2022ᅳ2024)," supported by the Ministry of Science and ICT.
Department of Structural Engineering Research
Date
2024-12-27
Hit
1305
첫페이지
이전페이지
1
2
다음페이지
마지막페이지
TOP
QUICK
QUICK
SERVICE
KICT 안내
찾아오시는 길
주요문의처
조직도
연구분야
기업지원
표준품셈
기술이전 및 사업화
인증/인정/시험신청
건설기술정보시스템
HOT LINK
고객지원
묻고답하기
정규직 채용안내
정기간행물
보도자료
닫기